My professional path
The most important fact about my professional life it's that its diverse: I majored in communications, fiddled around with cuisine, to eventually become a customer service and sales specialist. I've lived and worked in 4 different countries: Venezuela, Spain, France and Colombia.Since 2016 I've focused in customer satisfaction, sales and account management. I particularly enjoy the problem solving challenges my jobs have always had. I thrive when working on a challenge, it's where I do best.Back in 2021, working at IE University, I was invited to take part in a Data Visualization for Business high impact course that ended up changing my life.It kindled a light in me: a sudden new passion for analyzing data and further understanding the behavior, the trends, the patterns underneath it.I started playing around with Tableau and PowerBI, on personal and professional projects, but it wasn't enough. I wanted more. I wanted a new professional challenge. The biggest one yet.Link to my CV
Taking action
At first I started on my own: I tried to teach myself Python, SQL, but I struggled finding structured content to follow and guidance.Which is why I decided to join a Data Analytics bootcamp at Ironhack, in august last year, for three main reasons:- Build my Tech stack: SQL, Python, Tableau, PowerBI, Excel
- Expand my professional network even more
- Pivot into a Data Analyst career, at my own paceThe ride was intense. The learning curve was steep and the rhythm demanding. I needed to learn fast, persist and practice, if I wanted concepts to stick.I learned a great deal of things: Python, SQL, web scraping, building ETL pipelines, data processing and manipulation, EDA, hypothesis testing, machine learning, data visualization, deployment using Flask, and a lot more.Here are some of my Data projects from the past 6 months. Make sure to check the full dashboards in my Tableau profile
Tableau project: exploring subjective wellbeing
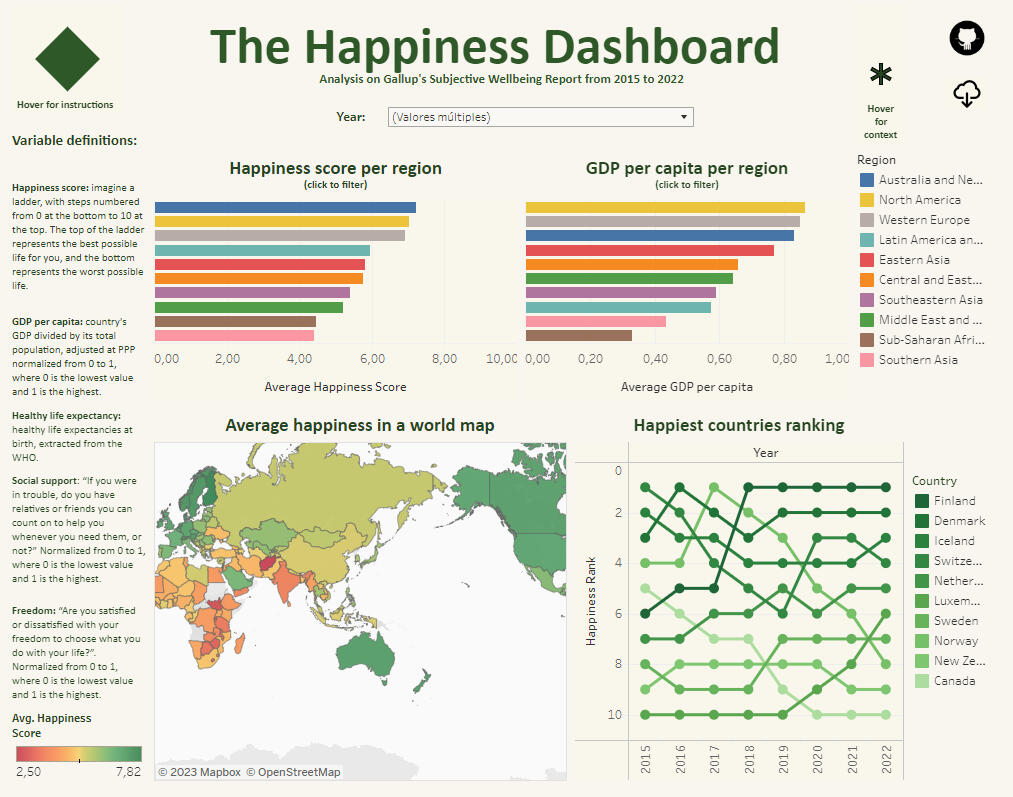
For my first Tableau project, I chose to explore Gallup's world happiness reports, from 2015 to 2022.Subjective wellbeing is a topic that has been particularly interesting to me for a long time.I gathered the datasets from Kaggle and I started exploring the variables.
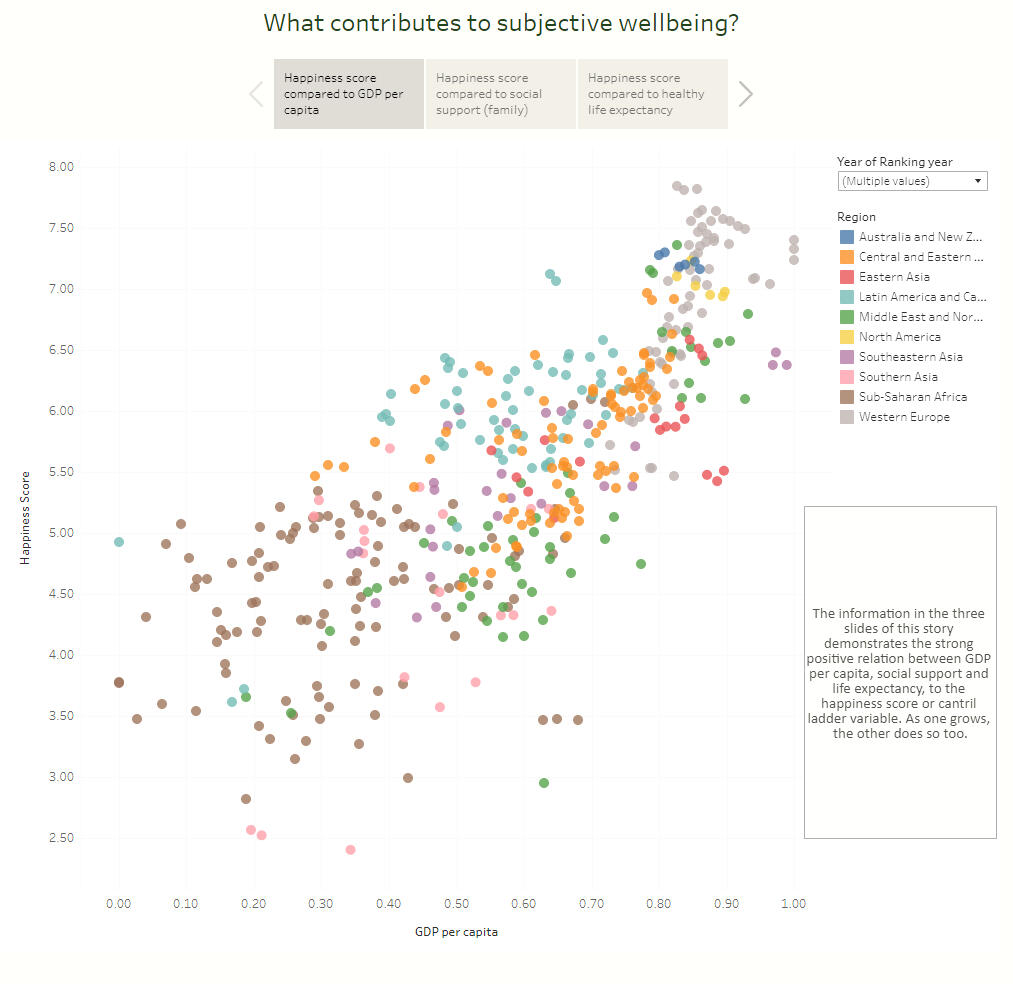
Apart from the evidenced inequality when comparing all regions, it was particularly interesting to check the positive correlation between elements like GDP per capita, healthy life expectancy and degree of freedom, with people's perception of wellbeing.As one variable grows, the other does as well.A second interesting fact to check is the variability or spread of the data, per region. For example, countries in the Latin America and Caribbean are more spread out than Western European countries. There is more variability in the former, than in the latter.
Mid-bootcamp project: measuring the impact of the 4-day work week
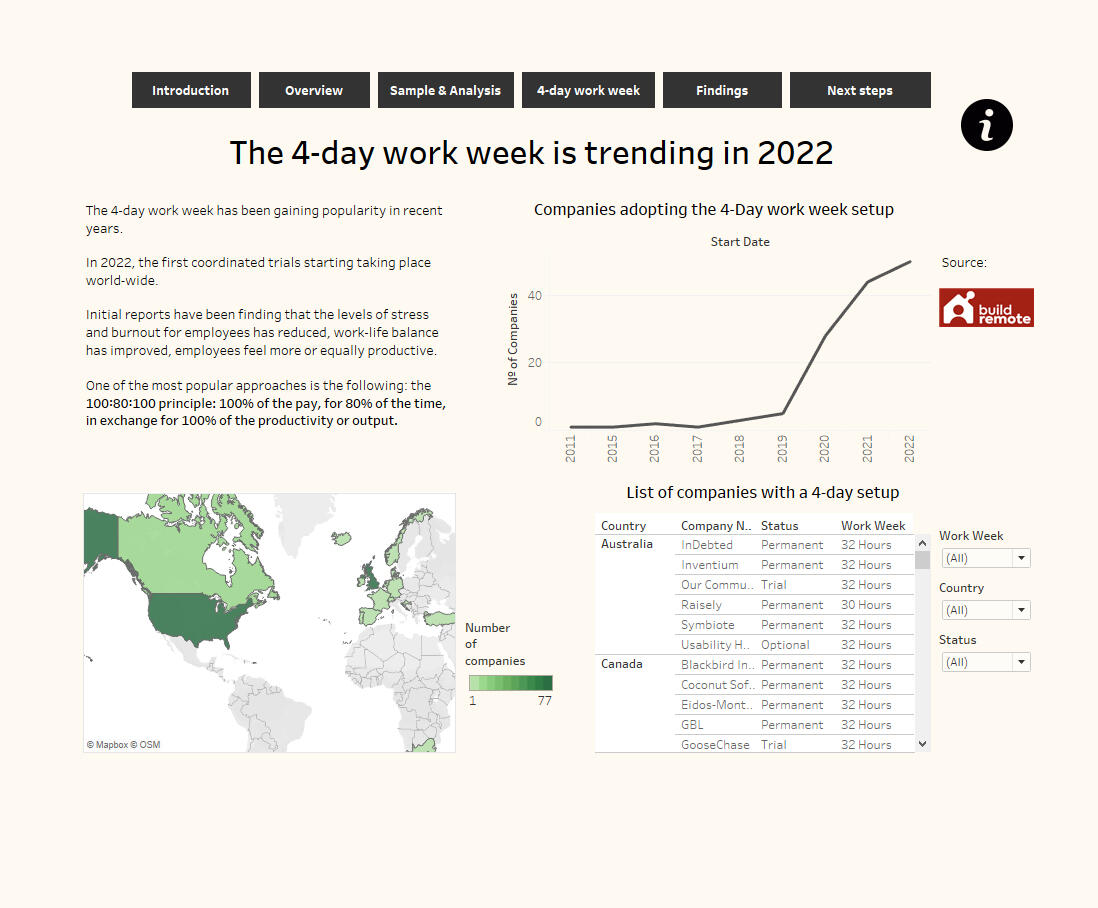
In this particular project, I wanted to focus more on wellbeing at the workplace.I began researching about the 4 day work week initiative, and about the pilots that started taking place in the US, UK and Europe. The first results looked promising, so I continued the quest.
At this point I had to go through the complete data workflow: I started designing a survey, gathering 80+ responses.Then I built an ETL pipeline, pre-processed and cleaned the data using Pandas and Numpy, performed an initial EDA with matplotlib and seaborn, to finally create my service layer: a Tableau dashboard.
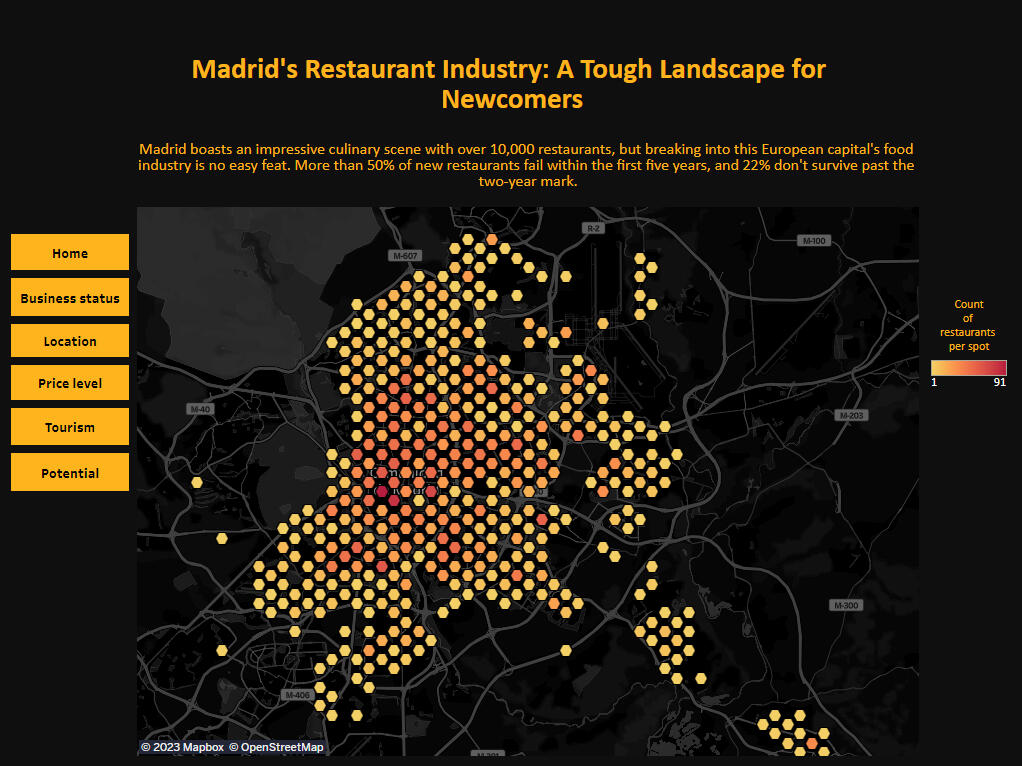
Final bootcamp project: building a restaurant viability predictor
This project offers a comprehensive analysis of over 6,000 restaurants in Madrid, providing valuable insights to help guide restaurant entrepreneurs' business decisions.I used data from the Google Places API to gather extensive information about each restaurant, and I enriched that dataset with public data on the city's demographics, economics, tourism, and foot traffic to provide a well-rounded understanding of the local market.
The product is twofold: first, a highly visual and interactive dashboard that delivers actionable insights for even the most inexperienced entrepreneurs. Second, a restaurant viability predictor, that helps validate ideas and find the perfect audiences for them.With this product, any user can have access to critical data such as popular types of restaurant, average ratings, and customer demographics. Armed with this information, they can tailor their business strategy to meet the needs of their target audience and set themselves up for success.
Here is a demo of the web application I built using Flask, HTML and CSS: